


Maximizing Profit with a Drink Margin Calculator: Unlock the Secrets to Beverage Profitability
Drink Margin Calculator: Get the Most from Every Pour
Understanding how to calculate and optimise drink margins is crucial for bars and pubs to maintain profitability in today’s competitive landscape. By leveraging a drink margin calculator, operators can gain valuable insights and make informed decisions to boost their bottom line.
Key Takeaways:
- Gross Profit Margin vs. Net Profit Margin: Understand the difference and how to calculate both.
- Benchmarking Pour Costs by Beverage Type: Identify optimal targets for beer, wine, and cocktails.
- Optimizing Inventory Management: Strategies to reduce pour cost and shrinkage.
- Maximizing Profit per Unit: Leverage data to price drinks for maximum profitability.
- Using a Drink Margin Calculator: Unlock the insights to boost your bar’s financial performance.
Understanding Drink Margins: Core Concepts
At the heart of a successful bar or pub lies the ability to manage drink margins effectively. Profit margins in the beverage industry are measured in two key ways: gross profit margin and net profit margin. Gross profit margin, typically ranging from 75% to 80% for drinks in 2025, only accounts for the cost of goods sold (COGS), such as liquor, mixers, and garnishes. In contrast, net profit margin, averaging 10% to 15%, subtracts all operating expenses, including labour, rent, and utilities.
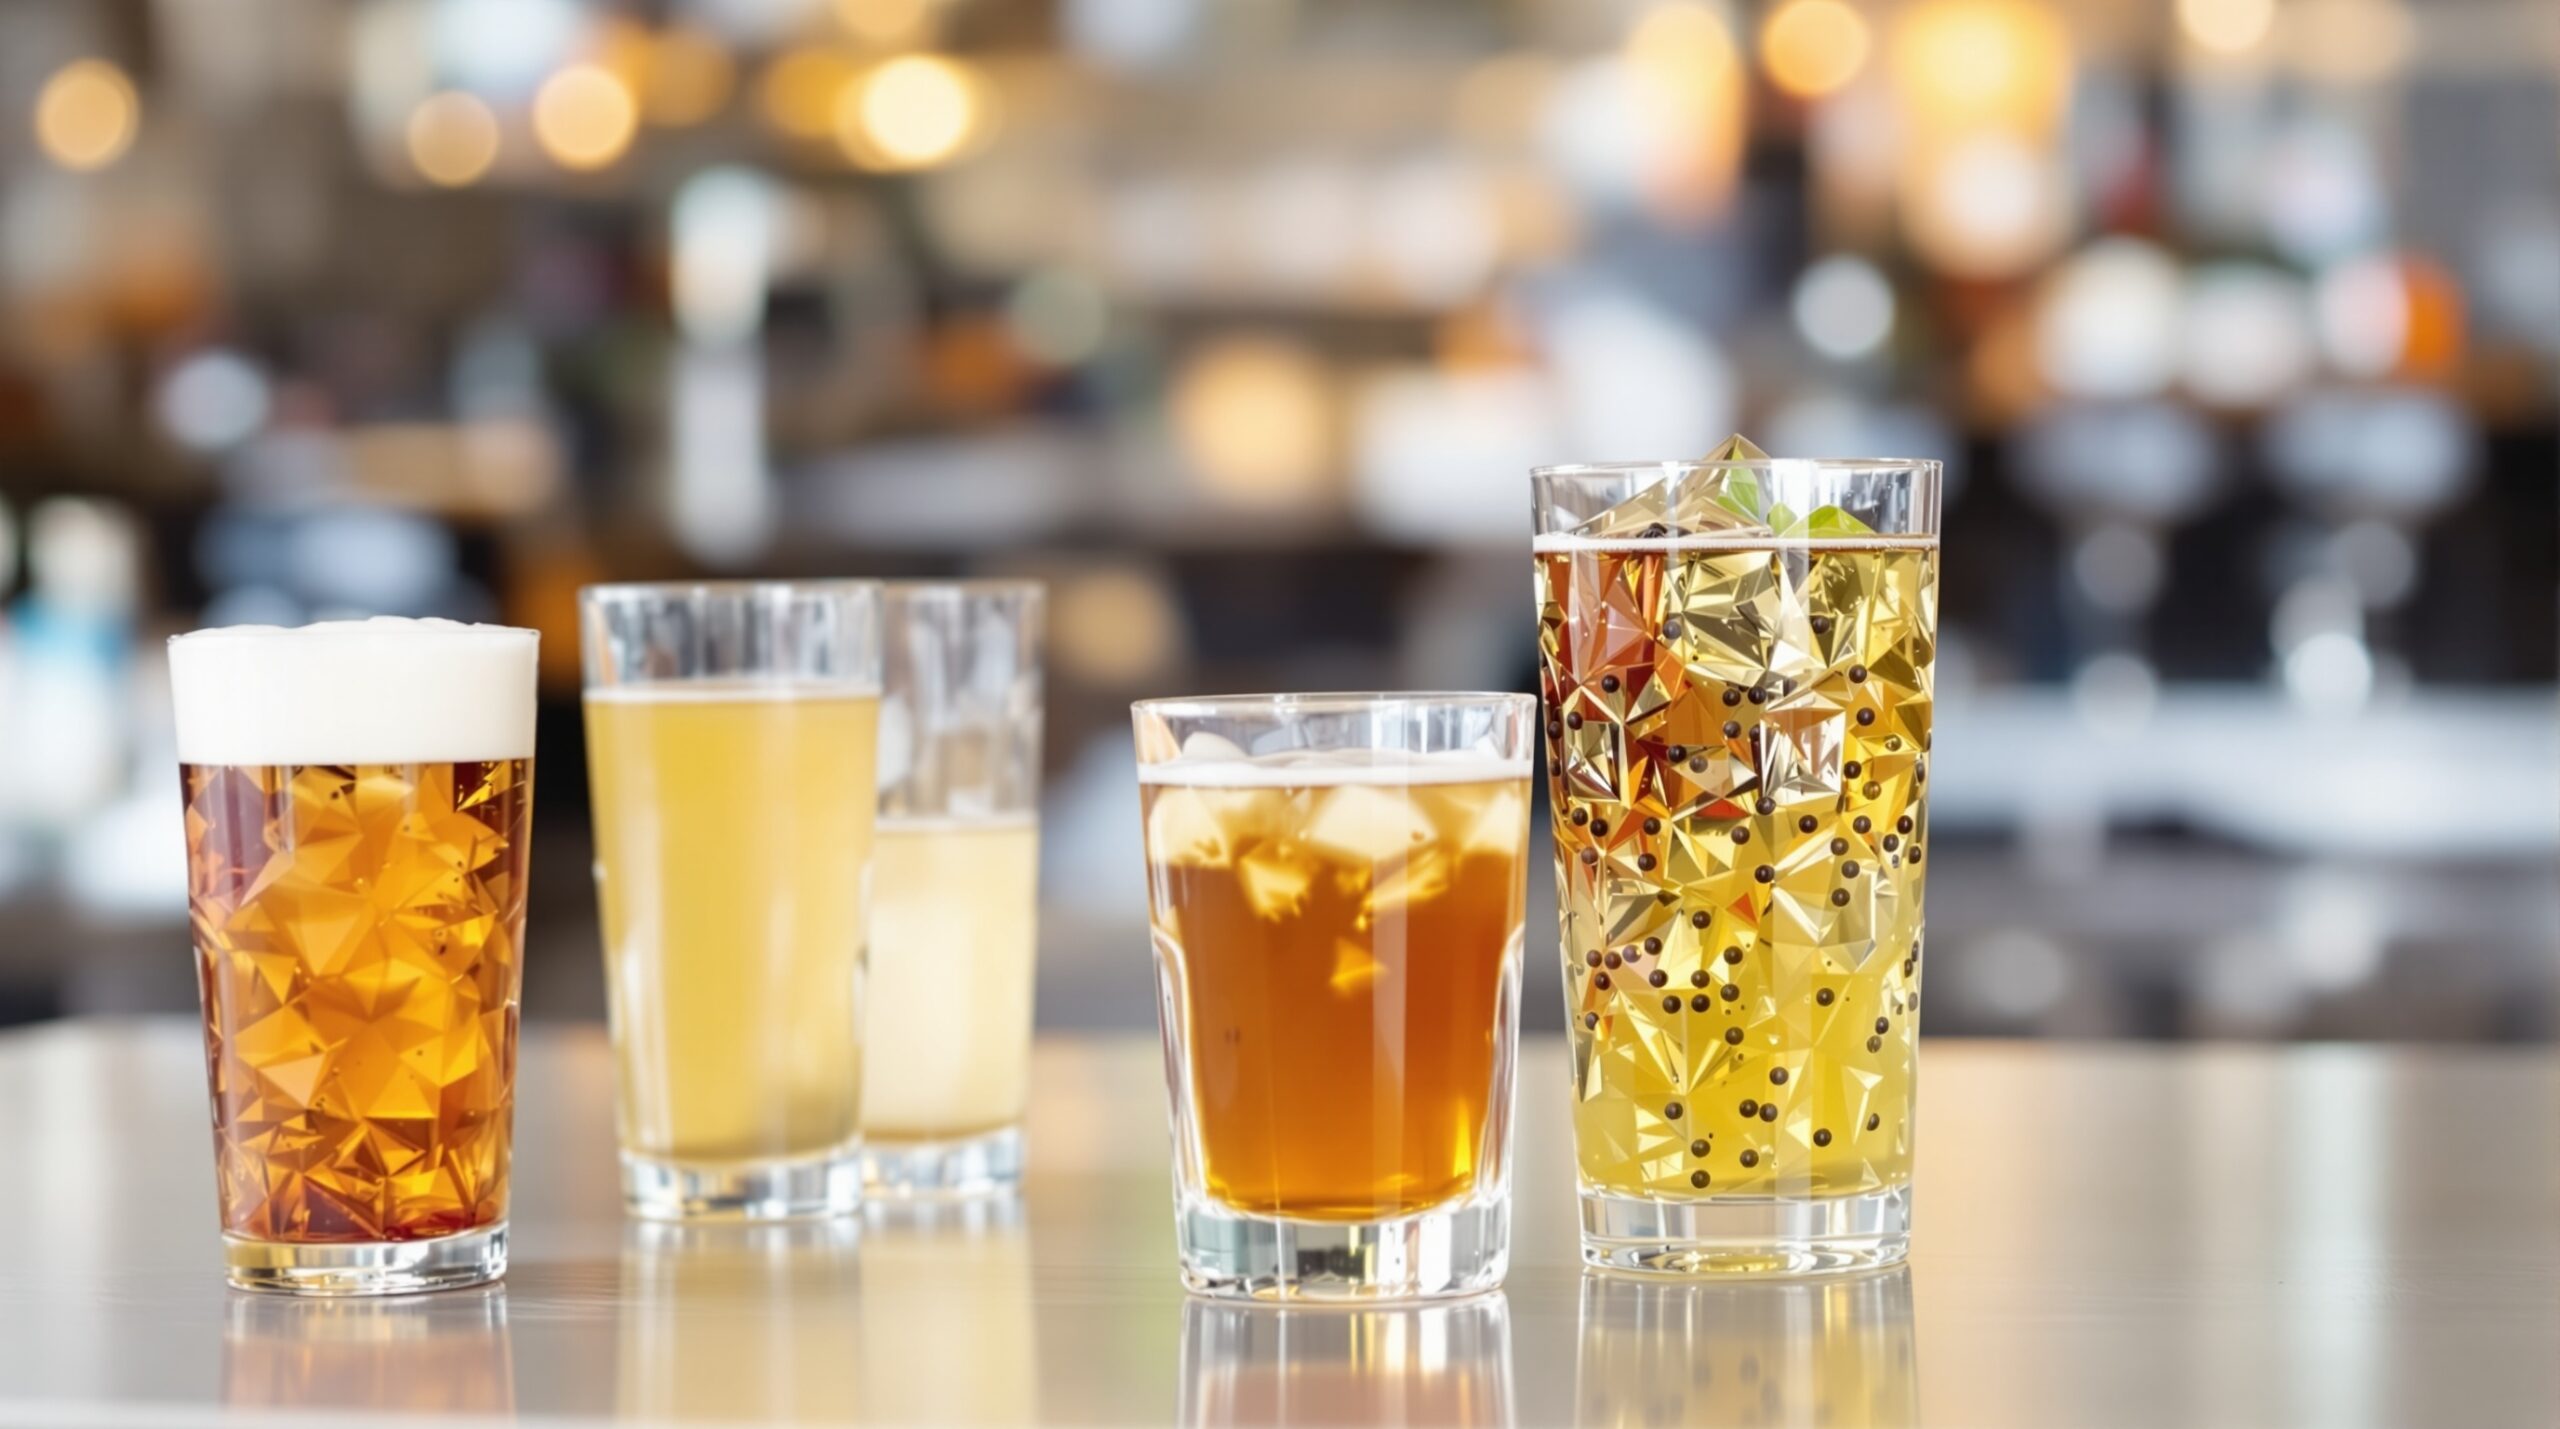
The pour cost, a key metric in the industry, represents the proportion of the drink’s selling price that goes towards the COGS. Benchmarks for pour costs are typically 24% for beer, 25% to 28% for wine, and 15% to 20% for premium spirits and cocktails.
How to Calculate Drink Profit Margins
To calculate the profit margin for a drink, you need to subtract all costs from the total revenue to determine the net profit, and then divide the net profit by the total revenue and multiply by 100. This formula can be applied to both the gross margin (focusing on drink production costs) and the net margin (including all expenses).
For example, if a bar has £50,000 in revenue and £42,500 in costs, the net profit would be £7,500. The profit margin would then be 15% (£7,500 / £50,000 x 100).
Average Profit Margins by Beverage Type
Understanding the typical profit margins for different beverage categories can help operators make informed pricing decisions and optimize their drink pricing. Here’s a breakdown of average profit margins by beverage type:
| Beverage Category | Avg. Pour Cost | Gross Margin | Profit per Unit |
|---|---|---|---|
| Draft Beer | 24% | 76% | £1.75–£2.75 |
| Bottled Beer | 24% | 76% | £1.30–£2.20 |
| Wine by the Glass | 25–28% | 72–75% | N/A |
| Bottled Wine | 18–22% | 78–82% | £15–£30/bottle |
| Well Cocktails | 18–24% | 76–82% | £2.30–£3.40 |
| Craft Cocktails | 15–20% | 80–85% | £4.15–£6.42 |
Optimizing Pour Cost and Inventory Management
Reducing the pour cost is a crucial strategy for improving drink profitability. The pour cost is calculated as the cost of alcohol inventory divided by the alcohol sales revenue. Lowering the pour cost can significantly boost the profit margin.
Common issues that drive up pour cost and reduce profitability include over-pouring, theft, and pricing errors. To maintain optimal profitability, operators should target pour costs of around 15% for premium spirits, 24% for beer, and 28% for wine, with an ideal overall pour cost of approximately 20%.
Effective inventory management is key to controlling pour costs. By implementing portion control measures and closely monitoring inventory levels, bar and pub owners can minimise waste, shrinkage, and pricing mistakes, ultimately improving their bottom line.
Conclusion
Leveraging a drink margin calculator is a powerful tool for bar and pub owners to gain valuable insights and make informed decisions about their beverage operations. By understanding the core concepts of drink margins, calculating profit margins accurately, and optimizing pour costs and inventory management, operators can maximize profitability and thrive in the competitive UK hospitality industry.
Sources:
Clarify Capital, “Are Bars Profitable in 2025? Key Stats & Owner Earnings”
7Shifts, “Bar’s Profit Margin: How to Calculate and Improve It”
SimplyDepo, “Profit Margin Formula: Essential for 2025 Success”
Bartenders Business, “How Pour Costs and Profit Margins Impact the Profitability of Your Bar”
Cabaret Design Group, “Most Profitable Bar Drinks | 2025 Profit Guide”
FullRatio, “Profit margin by industry”
